
At Abios, we are running Grafana and Prometheus for our operational insights. We are collecting all sorts of operational metrics such as request latency, active WebSocket connections, and cache statistics to determine if things are working as we expect them to.
For the most part, this works very well. However, when we want to determine specific request patterns, such as identifying who’s suddenly performed ten times the regular amount of requests or the location a widget has been loaded from, things start to get tricky. In other words, We would like to label all of the operational data with business information such as API key ID for API requests and the geographical location of the end-user for widget loads.
In addition to being able to view these metrics and breakdowns in Grafana dashboards, we would also like to expose these to each user in our dashboard so that our users can take part of the same insights.
This data does not necessarily need to be exact. The interpolating time series solutions for operational metrics are just fine. However, once we started adding these kinds of labels to our metrics we quickly ran into the problem of high cardinality. While we might not have had any trouble ingesting all of that data, we did have trouble querying it. Prometheus regularly started timing out after 60 seconds.
Prometheus explicitly recommends their users not to use high cardinality labels for their time-series data, which is exactly what we want to do. Prometheus is thus a poor solution to keep using. However, since we were already using Prometheus, we needed an alternative solution to be fully compatible with the Prometheus query language.
The options we decided to try were Timescale together with Promscale to act as a remote write intermediary and Victoria Metrics. In both cases we still used Prometheus Operator to launch Prometheus instances to scrape metrics and send them to the respective storage layers.
In short, Timescale is a time-series data extension to PostgreSQL and Promscale in an adapter that uses Timescale to implement a Prometheus-compatible time-series database that can be used as a remote_write target. VictoriaMetrics is, at its core, a time-series database built from the ground up using a ClickhouseDB-inspired MergeTree table. In addition, VictoriaMetrics has also built auxiliary applications such as metrics collection, backup management and a Kubernetes Operator.
The Setup
At the time of launching our different alternatives, we ingest about ~350K time series with the highest cardinality metric having a cardinality of 14516. This is not a particularly large amount of data nor is the cardinality particularly high. TimescaleDB claims to handle cardinality in the millions and VictoriaMetrics claims to handle essentially at least as much, but better. However, what all of these benchmarks have in common is that they primarily look at write performance, whereas for us it was the Prometheus query performance that fell flat.
For the first 3 weeks, we kept going with our current metrics, and for the latter 3 weeks we added the API key ID to one of our metrics in order to increase the label cardinality to the “least” we want to be able to handle.
The tests performed were anything but scientific and there is no attempt to produce proper benchmarks. Essentially, we just ran the different alternatives for about six weeks to see how they performed while ingesting and querying, as well as things like disk utilisation, upgrade behaviour and so on. Essentially, we are trying to get some kind of holistic feel for both alternatives; How they are to work with.
The existing solution is a Prometheus Operator operated Prometheus StatefulSet with 2 replicas. They both scrape for all metrics and store all data by themselves in persistent volumes.
For VictoriaMetrics we set up a t4g.large (2 vCPUs & 8GiB memory) EC2 instance with 200GB of disk. This has a cost of about $80 a month. We launched a new StatefulSet of Prometheus with only one replica that had the VictoriaMetrics instance configured as the remote write storage layer and configured a Grafana data source to query VictoriaMetrics directly.
We used Timescale Cloud to launch what they call “Timescale-basic-100-compute-optimized (4 CPU, 16 GB RAM, 100 GB storage, backup up to 2 days with PITR)”. This instance cost $642 per month. We chose this one rather than their 2CPU/8GB RAM option because the smaller one didn’t have enough resources to handle both ingestion and querying at the same time. In this case, we ran a Prometheus StatefulSet of one replica with Promscale as a sidecar container. Prometheus then sent writes to Promscale (inside the same pod) that forwarded the data to the TimescaleDB instance in Timescale Cloud. Reads were sent directly to Promscale.
After 3 weeks
Operations
Unfortunately, the 100GB disk of our TimescaleDB instance was fully utilised before the first 21 days. I lowered the retention period to 14 days and call the execute_maintenance() Postgres/Timescale function in an attempt to free up some disk space but the function timed out after a couple of hours and the disk was still full. TimescaleDB was also by far the most resource-hungry in terms of CPU, with the database using around 30% CPU at any given moment.
The VictoriaMetrics ec2-instance for the same period used around 15GB of disk and hovered around 3% CPU usage with up to 10-15% during heavy querying.
| Timescale | VictoriaMetrics | |
| CPU | 4 | 2 |
| CPU Usage | 30% | 3% |
| CPU Usage during queries | ~70% | ~15% |
| Disk Usage | 100GB | 15GB |
Query Performance
The query performance of Promscale/TimescaleDB was abysmal with requests for only a couple of days timing out after 60 seconds. I cannot say for sure if it was Promscale or TimescaleDB that was the bottleneck here but in the end, it doesn’t matter for us. With that said, Promscale is still somewhat young and the team has been helpful in trying to resolve these issues. I’m sure things will improve with time.
As for the performance between stock Prometheus and VictoriaMetrics, the latter was essentially at least as fast as the former. In some cases, Prometheus was half a second faster (out of a ~4-second query) but in some cases VictoriaMetrics came out ahead, if only ever so slightly. Both Prometheus and VictoriaMetrics work very well for our regular workload.
After “High Cardinality”
Before adding any kind of high cardinality labels I removed the now choked up Promscale and TimescaleDB deployment. While it might very well be the case that something was misconfigured (although I did follow the documentation) given the price (north of $600!) and query performance we’d seen enough to make a decision. With that said, I would definitely not rule out TimescaleDB or future versions of Promscale for other uses.
We added a label for API key ids to the atlas_request_latency_nanoseconds metric. This metric is a histogram that records latencies to our core API. This increased its label cardinality from 8163 to 27279. While it is a relatively large increase the cardinality is still well away from the millions.
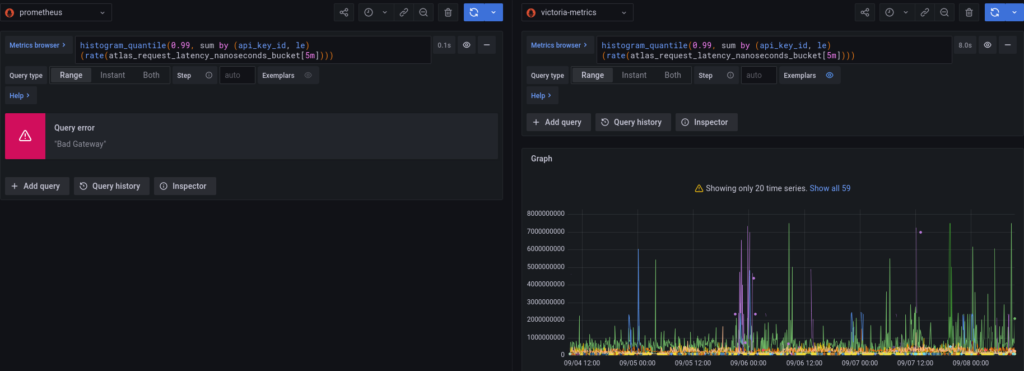
The results here are quite simple. When querying for a specific api_key_id, both Prometheus and VictoriaMetrics are about as fast, with Prometheus holding a slight edge. When aggregating all api_key_ids (e.g histogram_quantile(0.99, sum by (api_key_id, le) (rate(atlas_request_latency_nanoseconds_bucket[5m])))) then Prometheus times out when we start querying for 4 days of data whereas VictoriaMetrics manages in about 8 seconds.
Final Thoughts
Of course, this is not an apples to apples comparison since our Prometheus instances are running in Kubernetes and VictoriaMetrics is running on a dedicated ec2-instance. However, some key things do differ from an operational point of view.
The biggest difference for our day-to-day operation is perhaps that VictoriaMetrics does not have a Write-Ahead log. The WAL has caused us trouble when Prometheus has experienced issues and starts to run out of RAM when replaying the WAL, thus entering a crash-loop.
Though the differences are quite small between Prometheus and VictoriaMetrics, the latter has just been a little smoother, is more modular, has more comprehensive documentation and is somewhat more performant. Note that none of this is based on actual benchmarks but essentially just the load times of our internal dashboards.
VictoriaMetrics has also extended the querying language and solved some of the unintuitive behaviour of Prometheus.
All in all, we are quite impressed with VictoriaMetrics. Not only is the core time-series database well designed, easy to deploy and operate, and performant but the entire ecosystem around it seems to have been given an equal amount of love. There are utilities for things such as taking snapshots (backups) and storing to S3 (and reloading from S3), a Kubernetes Operator, and authentication proxies. It also provides a cluster deployment option if we were to scale up to those numbers.
From a usability point of view, VictoriaMetrics is the clear winner. Neither Prometheus nor Timescale managed to do any kind of aggregations on our high cardinality metrics, whereas VictoriaMetrics does.We are going to migrate to VictoriaMetrics. We will likely keep the current single-instance setup on the t4g.large but replace the Prometheus instance with VictoriaMetrics Agent for scraping metrics before we replace the current stack completely. We do like the pattern of configuring scrape targets via Kubernetes CRDs so we’ll likely launch the Kubernetes Operator to manage VMAgent and scrape targets.